A conversion is an action a business chooses to count, such as a purchase or sign-up. Counting that action does not measure the person’s understanding of the terms or satisfaction with the result.
What did the business count? A shop might count a completed order; another team might count adding an item to a basket. Comparing their conversion rates without that detail compares different actions.
Consider an invented checkout with 1,000 visits and 40 completed orders. Its order conversion rate is 4%. If the team changes its goal to basket additions and records 180, the new rate is 18%. The larger number does not show that more people bought anything.
Counting rules matter too. Does one person making three orders count once or three times? Does the report remove cancellations? Was the percentage calculated from all visits or only some of them? An apparently simple percentage contains those decisions.
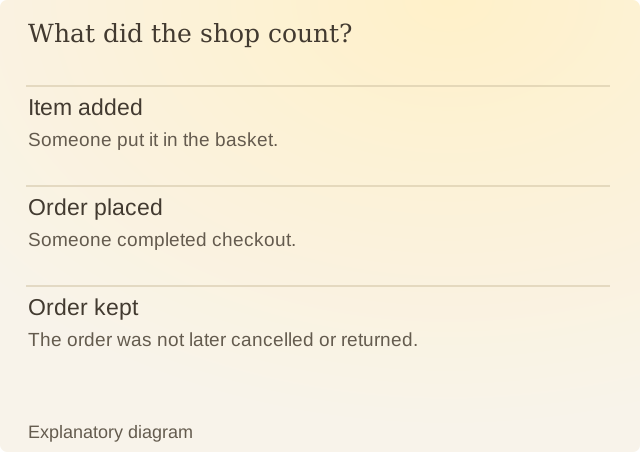
Read the diagram
| Item | Question or meaning |
|---|---|
| Item added | Someone put it in the basket. |
| Order placed | Someone completed checkout. |
| Order kept | The order was not later cancelled or returned. |
Firebase’s experiment documentation describes comparing different versions by a result the team chooses to count. The team might count orders and leave refunds out of that comparison.
To understand how buying went, ask: could the person review the total, did the order arrive, and did the product meet the stated need? An order count cannot answer them. Delivery records can show arrival. The buyer can tell you whether the item met their need.
Keep the event definition beside the rate when comparing campaigns. A sign-up rate and a purchase rate describe different outcomes, even if both reports call them conversions.
Sources
Firebase: About A/B testsFirebase’s guide to comparing versions using chosen results, such as orders or sign-ups.