An A/B test compares two versions, such as a smaller and larger checkout button. A winner may get more orders while leaving unanswered whether buyers understood the fees.
What was the test trying to improve?
Firebase’s A/B documentation describes choosing a version by a main goal and checking other results before releasing it. A version can get more orders while also getting more cancellations.
Consider two fictional groups, each with 1,000 visitors. A small confirmation button produces 40 orders; a larger button produces 55. The observed order rates are 4% and 5.5%. The increase is 1.5 percentage points, or 37.5% relative to the original rate.
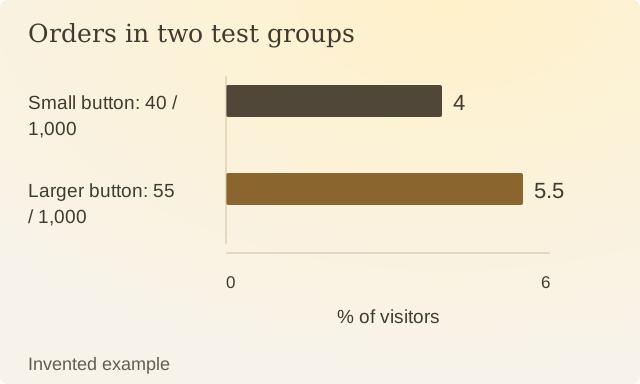
Read the values
| Item | Value |
|---|---|
| Small button: 40 / 1,000 | 4 % of visitors |
| Larger button: 55 / 1,000 | 5.5 % of visitors |
Those are two ways of describing the same arithmetic. Use the planned statistical analysis to assess how compatible the difference is with chance. To assess understanding of the delivery fee, the experiment needs a separate measure.
Ask who entered the test, how the groups were assigned, how long it ran and which outcome was chosen before results arrived. Testing many versions and reporting only the best-looking comparison can leave out useful context.
A stronger account reports costs too: mistaken orders, cancellations, complaints and task completion. The button may improve a business result while changing other parts of the experience. Seeing those measures together lets you see what improved and what got worse.
Sources
Firebase: About A/B testsFirebase’s guide to comparing versions using chosen results, such as orders or sign-ups.